The Little Colorado River is a river of extremes. Its upper reaches experience prolonged periods of low discharge interrupted by large, sometimes spectacular floods. Farther downstream, perennial springs support a remarkably different river environment as the Little C joins the Colorado River in Grand Canyon.
In October 2026, a major flood passed the USGS streamgage near Cameron, Arizona. The highest downloaded discharge observation reached approximately 18,000 cubic feet per second (cfs) on October 22, approaching the magnitude of the 1993 flood.
These figures explore this event in the context of the river's historical discharge record, using data from the U.S. Geological Survey. These figures use provisional data and are produced to share information rapidly as examples for discussion.
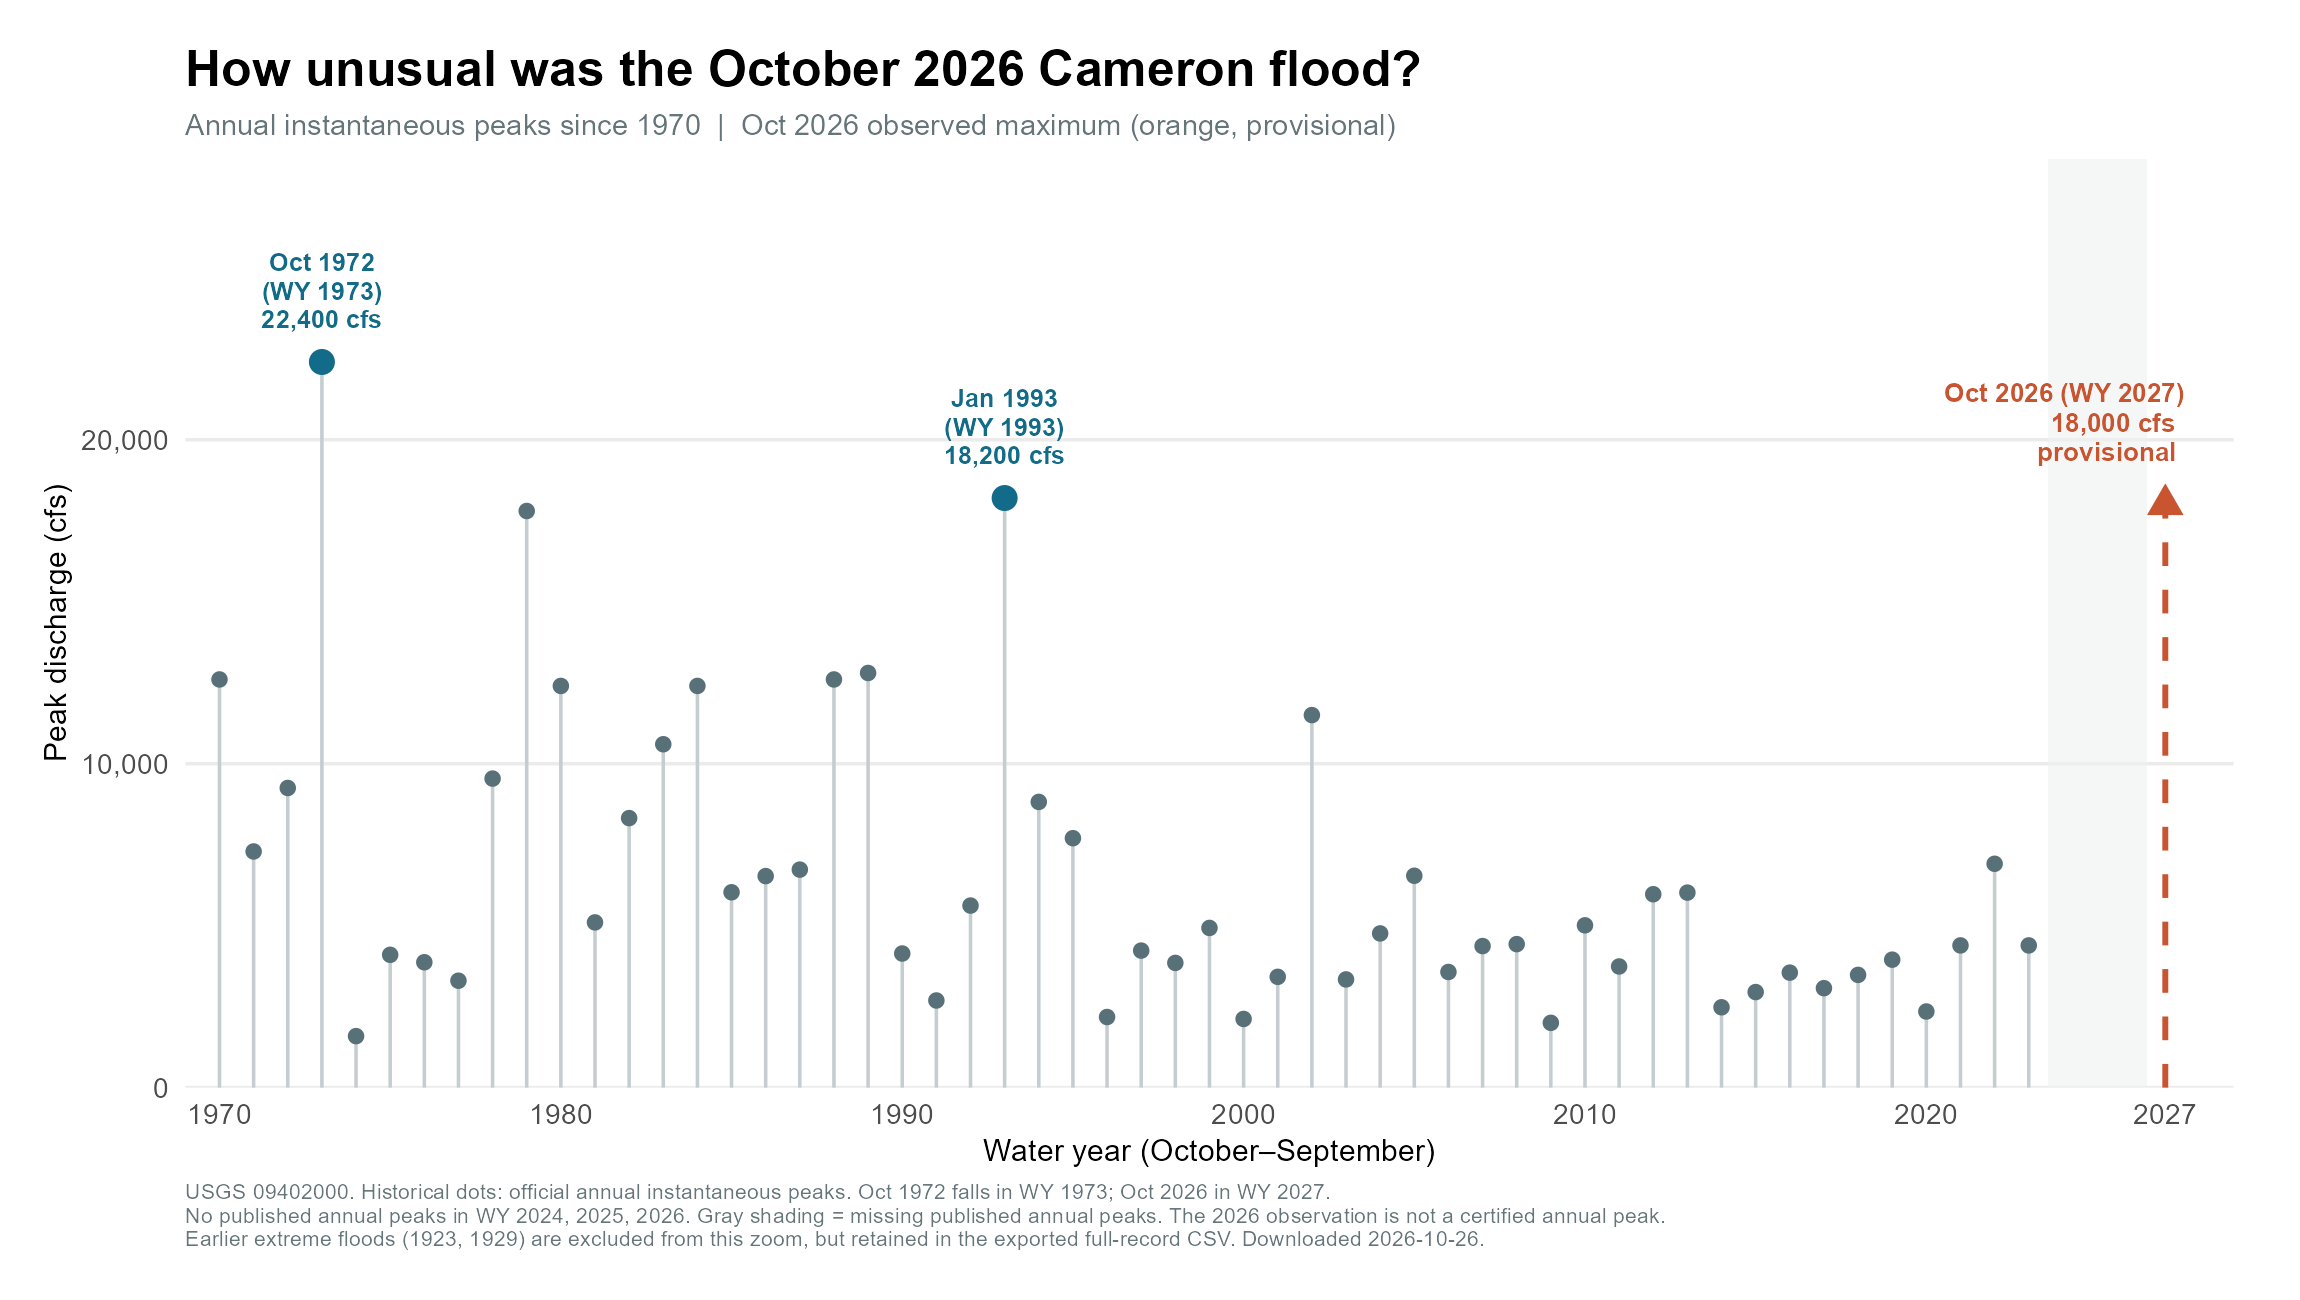
Annual maximum instantaneous discharge at the Little Colorado River near Cameron, Arizona, since 1970. The October 2026 flood reached a provisional 18,000 cfs, approaching the 1993 peak (18,200 cfs) and the October 1972 peak (22,400 cfs). Peaks are reported by water year (October–September). Official USGS annual peak records for water years 2024–2026 were unavailable at the time of analysis, so those years are not plotted. The October 2026 flood (water year 2027) is shown separately as a provisional observation.
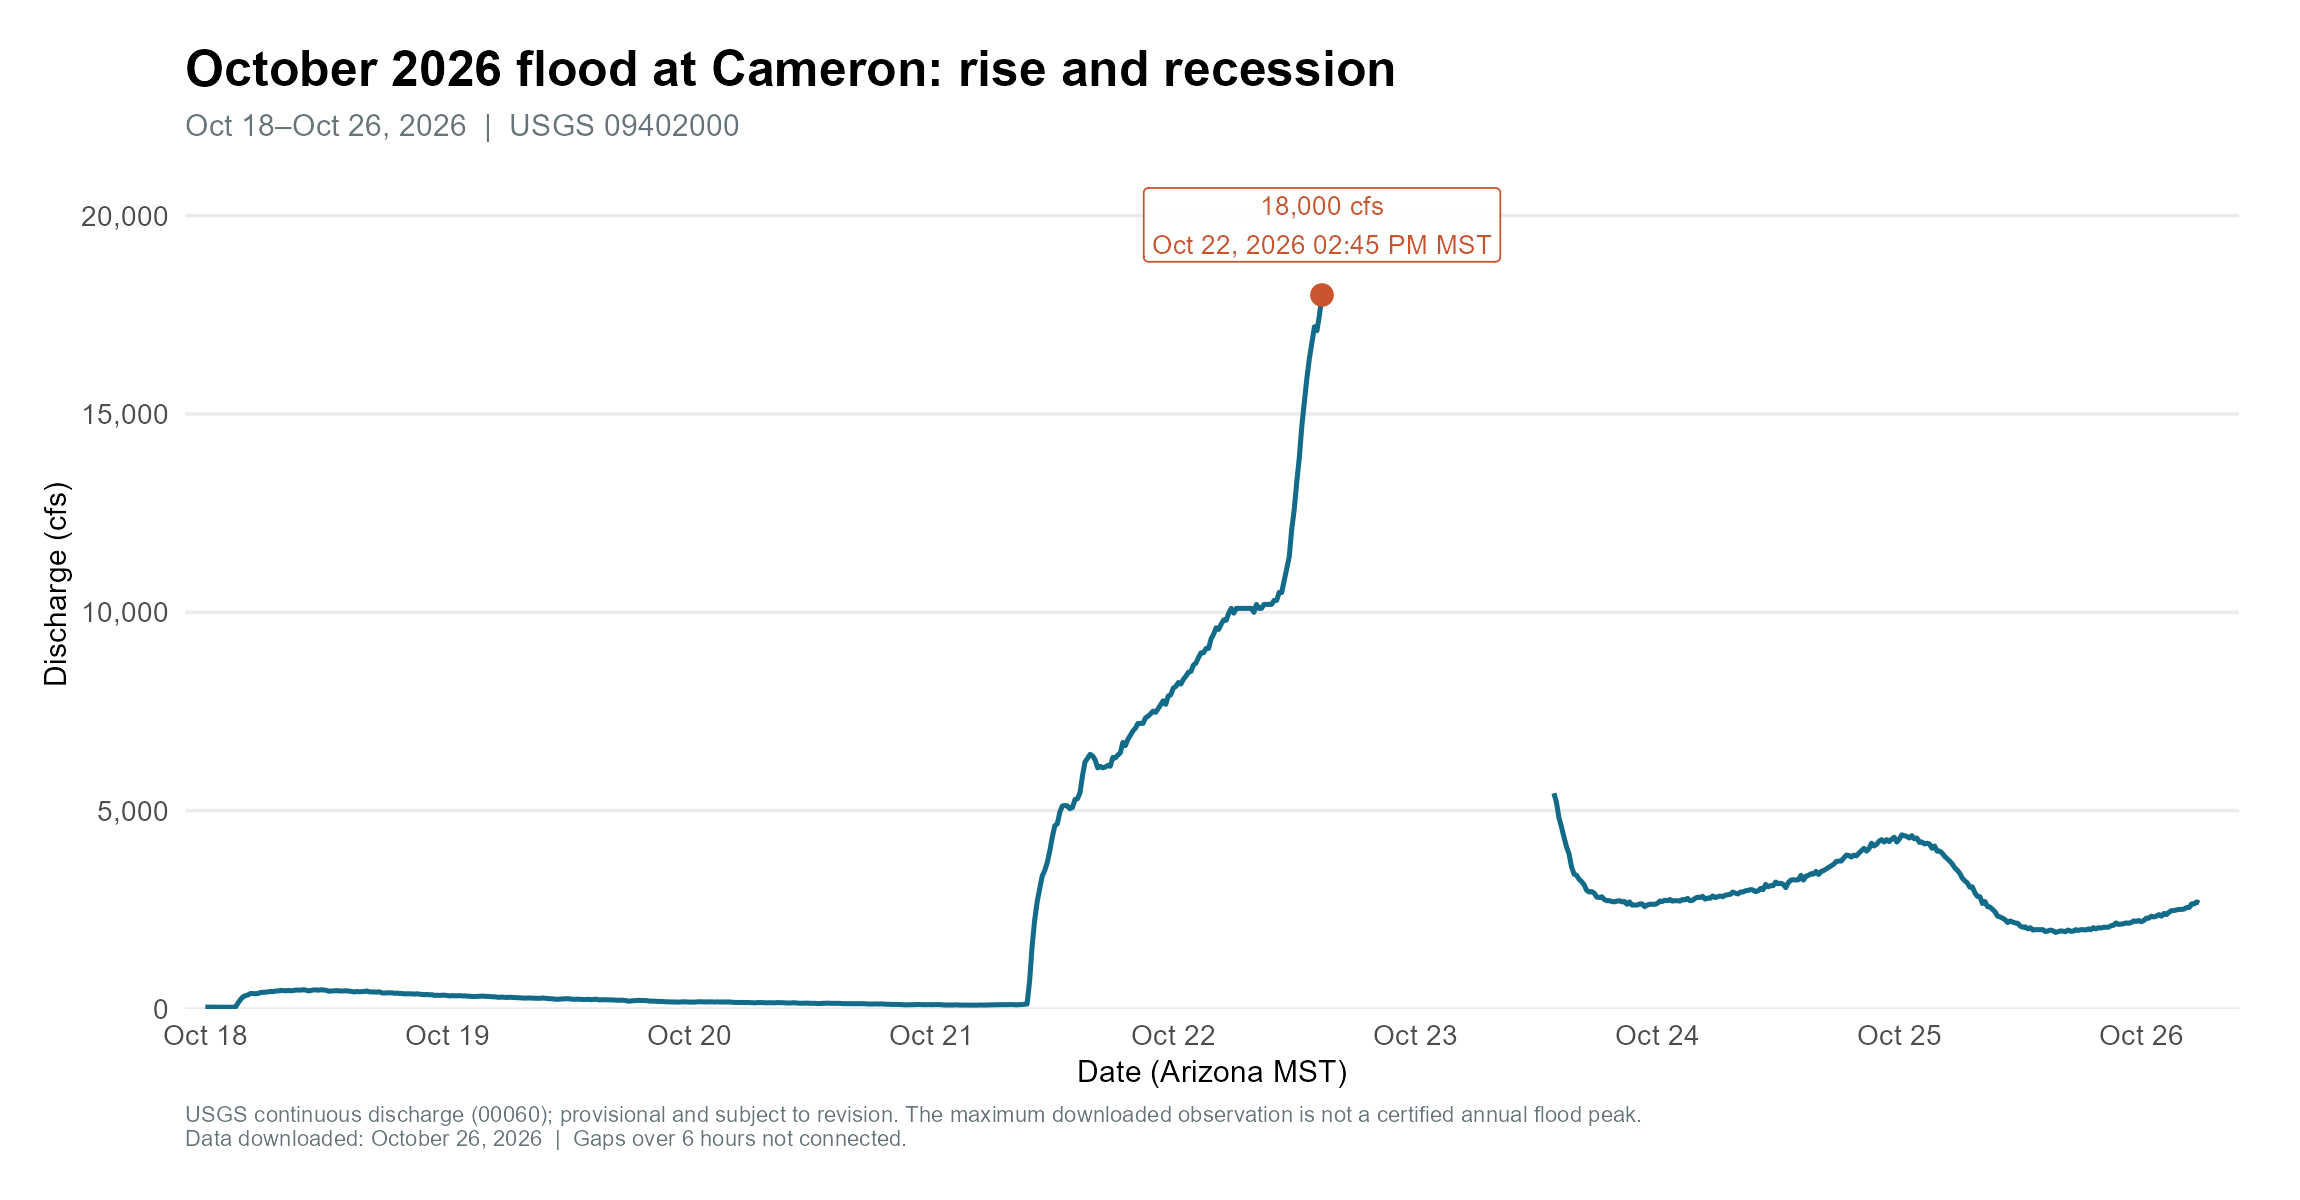
Discharge at the Little Colorado River near Cameron during October 18–26, 2026, showing the rapid rise of the October flood and its subsequent recession. Discharge increased from relatively low flows to a maximum observed value of 18,000 cfs on October 22. The break in the hydrograph following the peak represents a gap in available observations, rather than an abrupt decline in discharge. All recent observations are provisional and subject to revision by the USGS.
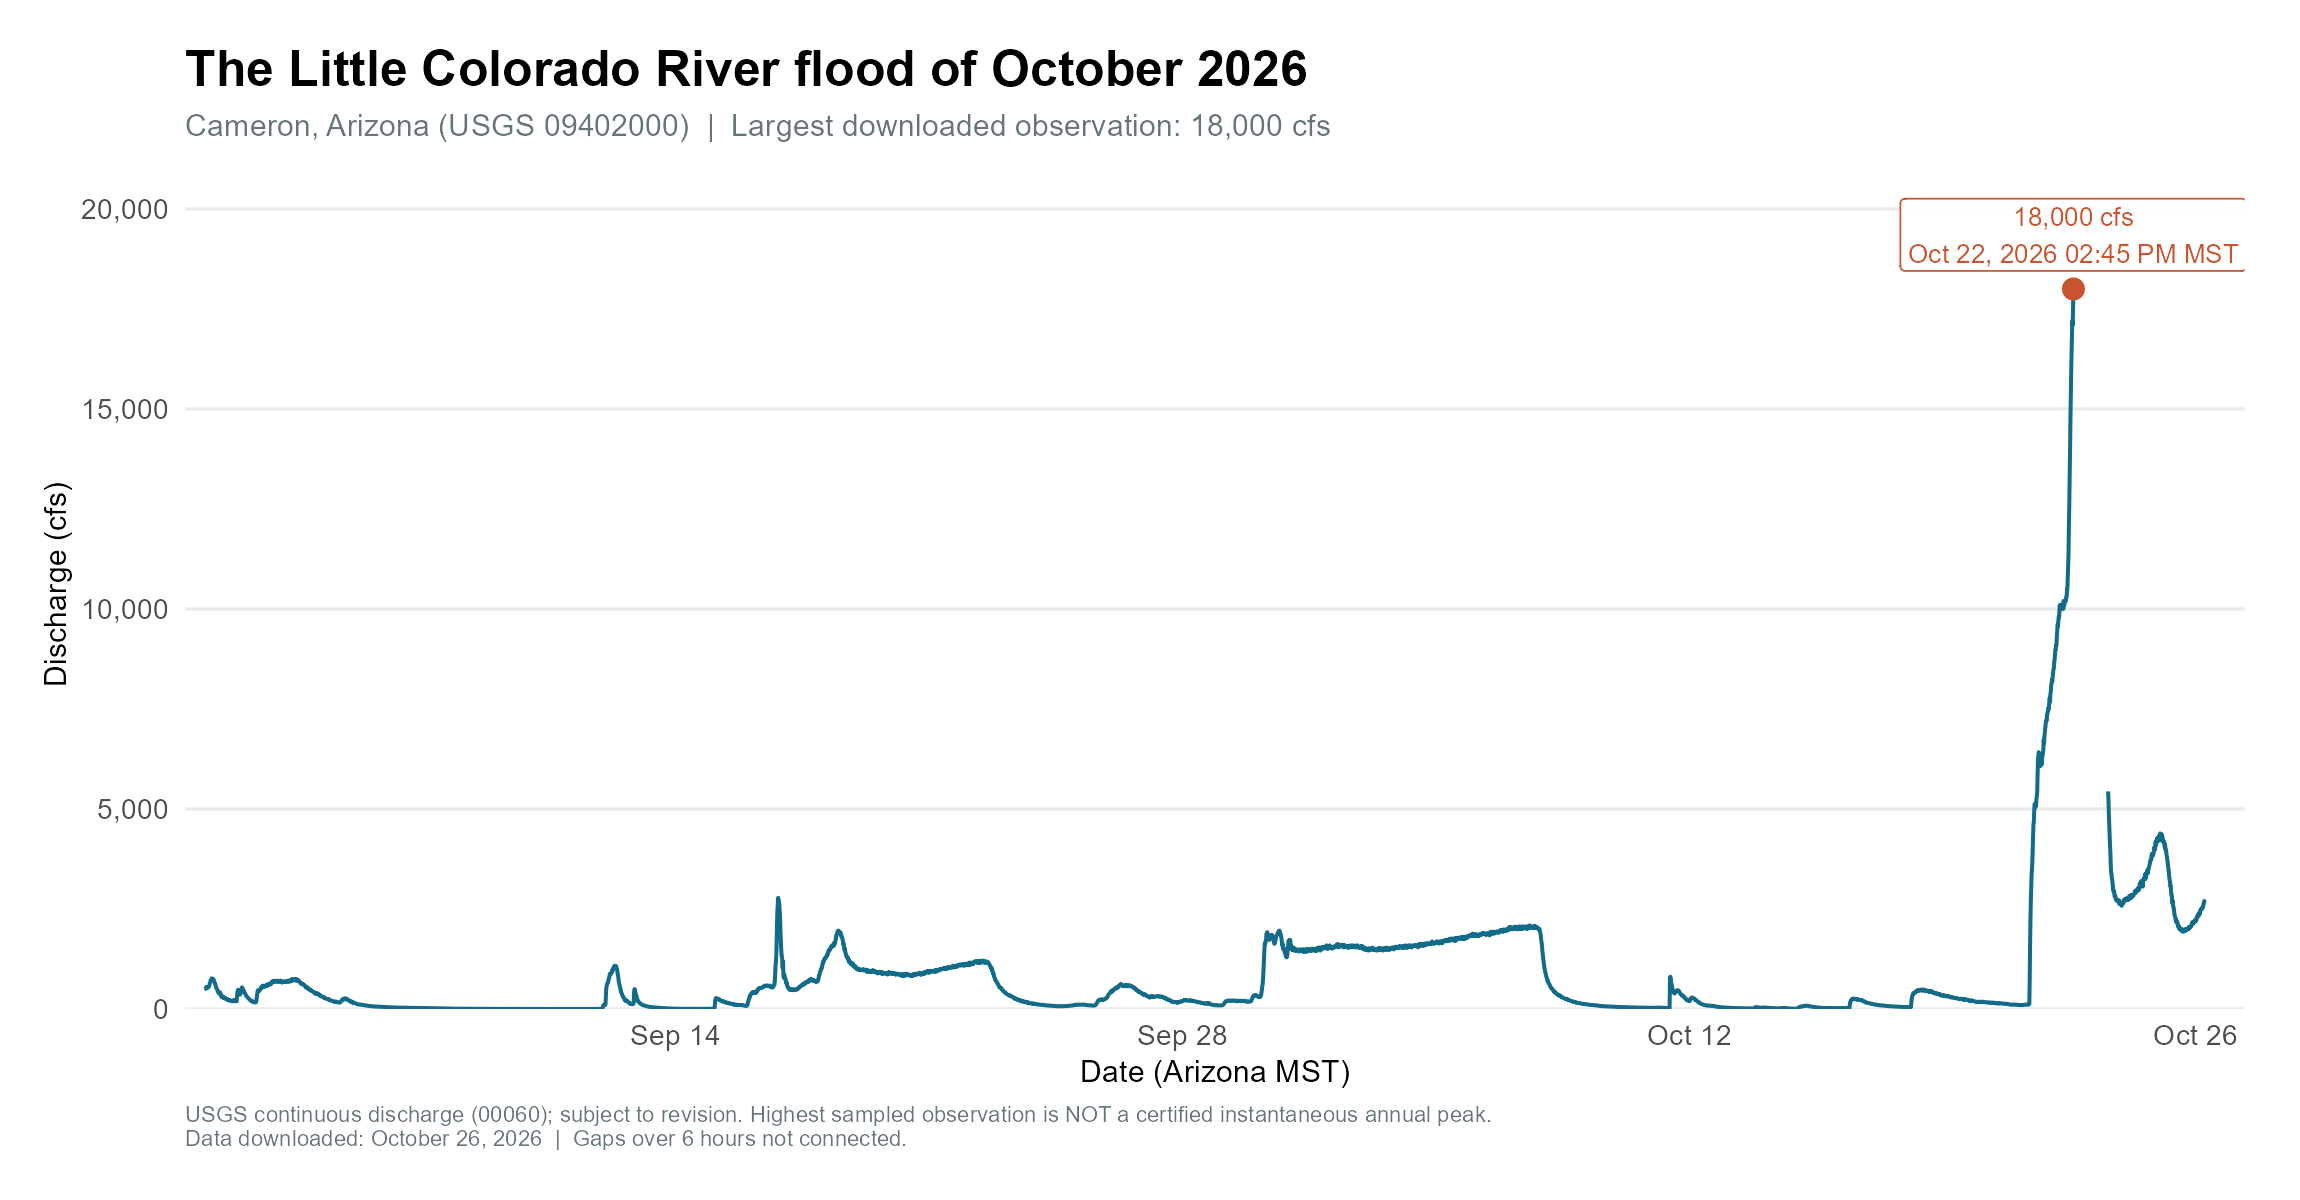
Discharge at the Little Colorado River near Cameron from September 1 through October 26, 2026. Several smaller flow events preceded the major October flood, illustrating the highly variable discharge characteristic of the Little Colorado River. The largest downloaded observation, 18,000 cfs on October 22, greatly exceeded flows during the preceding weeks. Observations are provisional, and gaps in the record may affect estimates of event magnitude and duration.
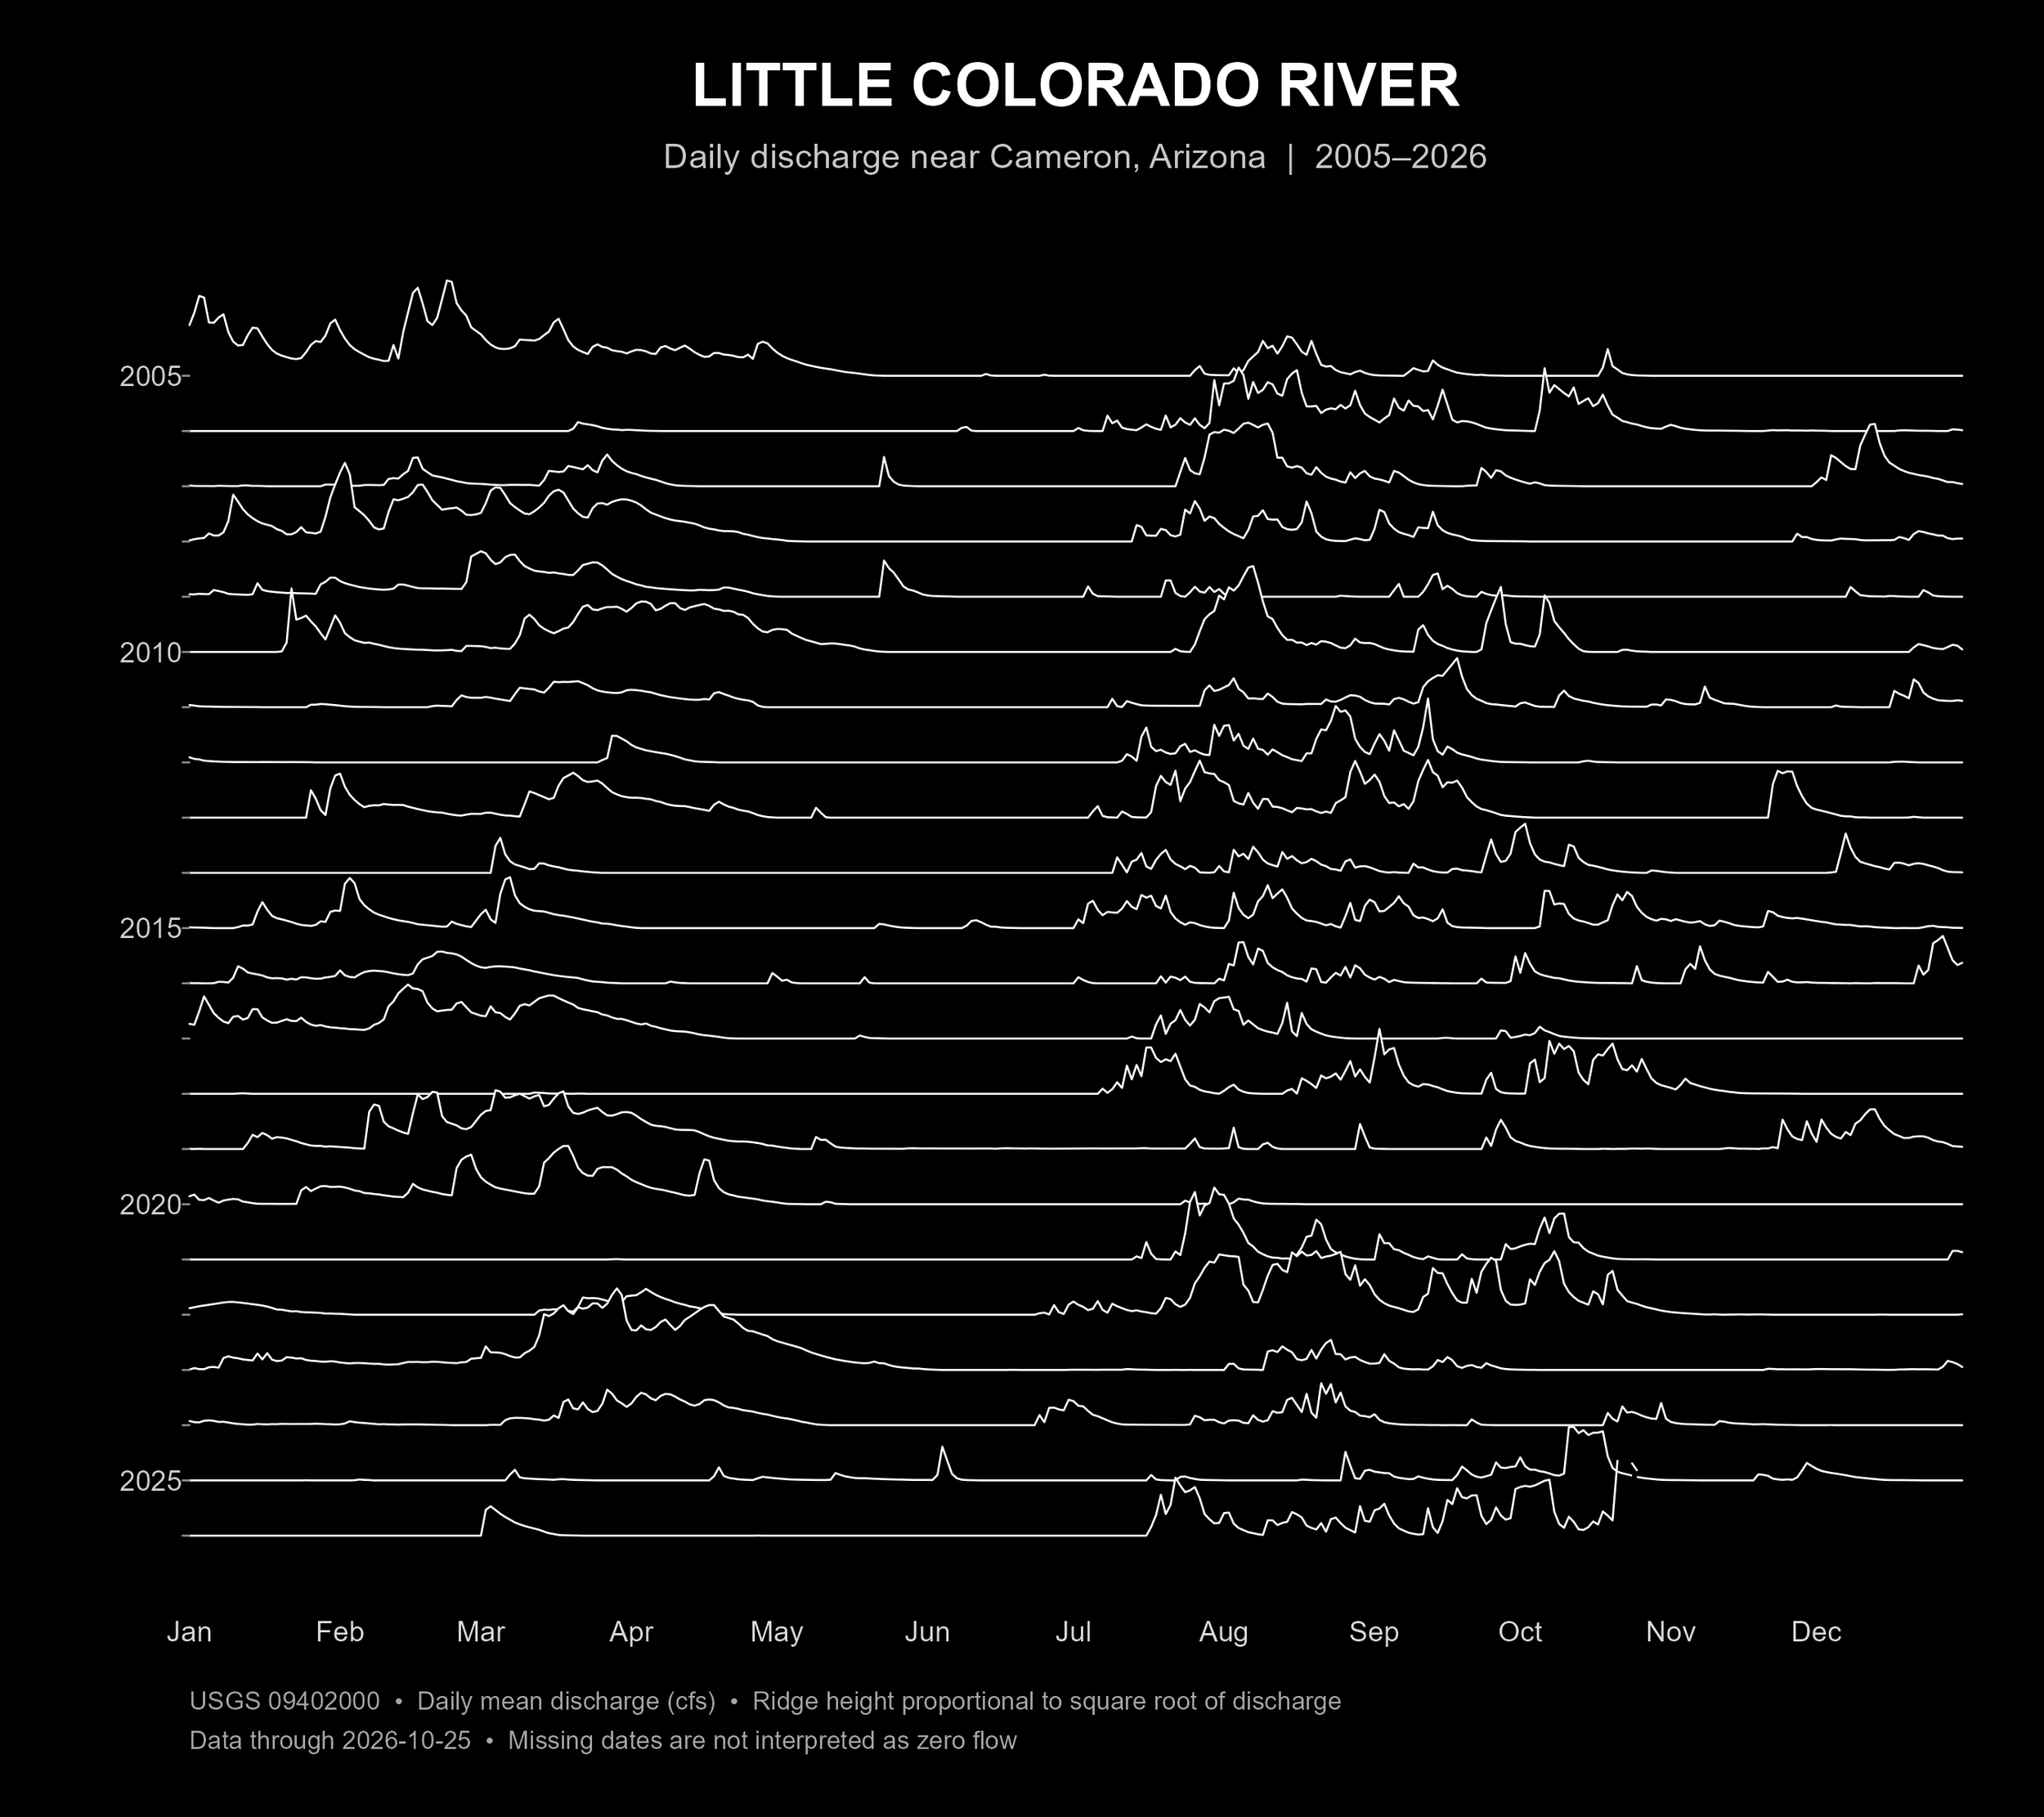
Daily discharge at the Little Colorado River near Cameron, Arizona, 2005–2026. Each ridgeline represents one year of daily mean streamflow, illustrating the river's highly variable discharge, with long periods of little or no flow interrupted by large floods. Ridge heights are square-root transformed to make smaller flow events more visible. Visualization adapted from R code by Lauren Steely (@MadreDeZanjas) and inspired by the iconic cover art designed by Peter Saville for the British band Joy Division's 1979 album Unknown Pleasures. Discharge data: U.S. Geological Survey, station 09402000.